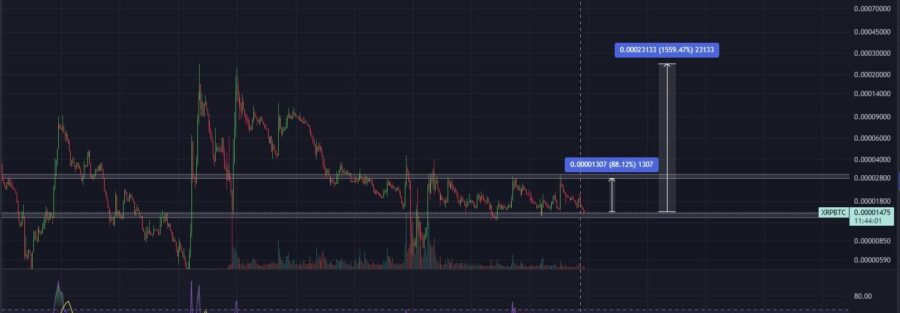
XRP’s impressive breakout and potential rally toward the $2 milestone have stirred excitement in the crypto currency market. The asset’s recent price action, which saw it surge past key resistance levels and maintain a strong upward trajectory, highlights robust bullish momentum. Buoyed by market optimism and increasing buying pressure, XRP has climbed above $1.40.
The surge in trading volume reflects growing market participation, further fueling the rally. While the RSI remains in the overbought zone, signaling heightened bullish sentiment, it also suggests the potential for short-term pullbacks. Supporting the bullish outlook is the formation of a golden cross, where the 50-day EMA crosses above the 200-day EMA historically reliable indicator of sustained upward movement over the medium to long term.
XRP now faces psychological resistance at $1.50. A decisive break above this level could propel the asset closer to the $2 mark. If $2 is breached, it would signify a critical milestone not reached in years, potentially ushering XRP into a new phase of price discovery.
Key support levels for XRP lie at $1.00 and $1.20, which are critical for maintaining its bullish structure. Holding above these levels is essential to sustain the current momentum. However, a breakdown below them could trigger a more significant retracement.
Despite the breakout’s strong potential, the overbought RSI and the likelihood of profit-taking may lead to short-term corrections. Still, XRP’s bullish outlook would be reinforced if it consolidates above $1.20 before resuming its upward climb.
Dogecoin is at a critical point, potentially forming a double-top pattern after its impressive recent rally. This pattern, often viewed as a bearish indicator, could signal a significant retracement if DOGE fails to sustain its current levels.
From its recent peak near $0.44, DOGE has pulled back and is now consolidating around $0.39. The retracement followed a strong surge that pushed the price past key resistance levels, driven by robust upward momentum. However, the declining trading volume compared to the initial rally suggests possible fatigue in the uptrend.
While bullish sentiment remains evident, with the RSI still in the overbought zone, the double-top formation could be confirmed if trading volume continues to weaken or if DOGE fails to break above the $0.44 resistance.
Dogecoin experienced a retracement after breaking through key resistance levels with strong upward momentum. However, declining trading volume compared to the initial rally indicates potential exhaustion in the trend. While the RSI remains in the overbought zone, signaling ongoing bullish sentiment, a double-top pattern could solidify if trading volume continues to weaken or DOGE fails to surpass the $0.44 resistance.
The $0.44 level serves as the immediate resistance. A breakout above this threshold would invalidate the double-top scenario, paving the way for DOGE to test $0.50 and potentially higher levels. On the downside, the first major support lies at $0.30, with additional support from the 50 EMA at $0.26. A break below the 50 EMA could accelerate the decline.
If the double-top pattern materializes, traders might lock in profits, potentially amplifying bearish momentum and leading to a significant correction in DOGE’s price.
DOGE could signal a continuation of its bullish trend if it consolidates above $0.39 and builds enough momentum to challenge the $0.44 resistance. The coin’s ability to hold its current level and attract fresh buyers will likely shape its next move.
While a rally remains possible, the significant risk of a retracement calls for caution. Traders are advised to closely monitor volume and price action around the $0.44 resistance to better anticipate DOGE’s trajectory in the coming days.
(ETH) appears to be forming a bearish double-top pattern, signaling a potential reversal in its recent bullish momentum. After a strong rally that saw ETH break through key resistance levels, this pattern raises concerns about a possible retracement that could hinder its price recovery.
The double-top pattern, often a precursor to a significant price decline, suggests waning buying momentum. Ethereum has formed two peaks on the daily chart but has struggled to surpass the critical $3,400 resistance.
The likelihood of a downturn increases if ETH fails to hold its current levels. This concern is amplified by declining trading volume, indicating reduced market enthusiasm. Additionally, the RSI, which is retreating from the overbought zone, supports the possibility of an impending correction.
Ethereum faces strong resistance at $3,400. A breakout above this level would invalidate the double-top pattern, potentially paving the way for gains toward $3,600 or higher. On the downside, immediate support lies at the 50 EMA, around $2,980.
A break below this support could trigger a sharper correction, driving ETH toward stronger support levels at $2,800 or $2,750. If the double-top formation materializes, it could undermine Ethereum ‘s recent recovery and lead to a significant retracement.


